To help you get started with executive reports, take a look at the examples below.
-
Make sure your report's data sources include all of the agencies, advertisers, and accounts that you want in the report.
-
Note that business data is supported in executive reports.
-
Check for updates for your browser.
While Search Ads 360 supports Internet Explorer, we recommend that you use Chrome or Firefox with Search Ads 360. Please note that we only support the latest version of your browser. If you're having problems accessing Search Ads 360, downloading reports, or accessing executive reports, check your browser extensions to make sure they're not blocking access. Also check your ad blocker because it might block certain Search Ads 360 features.
Last month's performance
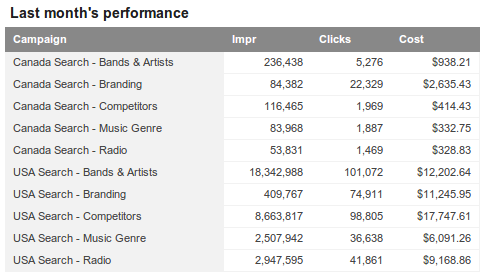
To summarize last month's performance, create a table with the following settings:
- Time Range - Select Last month
- Metric - Specify the following:
- Impr (impressions)
- Clicks
- Cost
- Segment - Select Campaign. Then click +Add campaign and add all of your campaigns.
Annual cost per engine
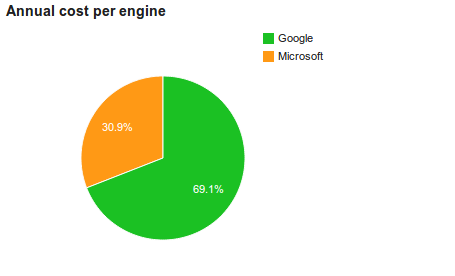
To compare annual spending between engine accounts, create a pie chart with the following settings:
- Time Range - Select Last year
- Metric - Select Cost
- Segment - Select Engine
Year to date volume
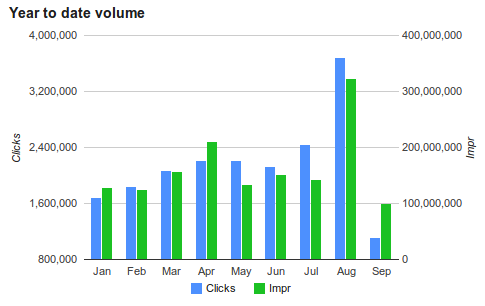
To view monthly totals for clicks and impressions across all of your engine accounts, create a bar chart with the following settings:
- Time Range - Select This year
- Metric - Specify the following:
- Clicks
- Impr (impressions)
- Segment - Select Month.
To show how each engine contributed to the monthly totals, click +Add segment and select Engine.
Year to date revenue vs cost
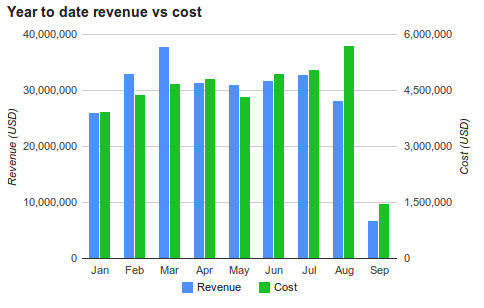
To compare revenue with costs for the current year, create a bar chart with the following settings:
- Time Range - Select This year
- Metric - Specify the following:
- Revenue
- Cost
- Segment - Select Month.
Weekly conversions from a Floodlight column
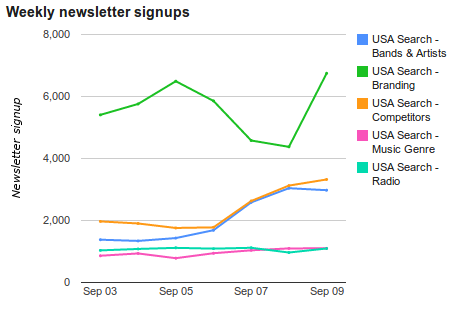
To show how Floodlight groups or activities are trending over the past seven days:
- Create a Floodlight column for a Floodlight activity or group.
- To show how conversions are trending over the past seven days across your campaigns, create a line chart with the following settings:
- Time Range - Select Last 7 days
- Metric - Do the following:
- Click
(the down arrow) to display the metric selector box.
- In left column of the metric selector box, click Floodlight columns.
- Select a Floodlight column.
- Click
- Segment - Do the following:
- Select Day.
- Click +Add segment and select Campaign
- For each of your campaigns, click +Add campaign and select a campaign.
Year to date engagement
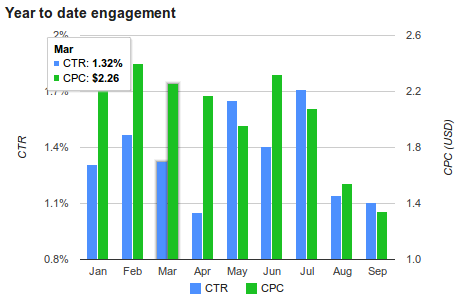
To show how many people have clicked on your ads so far this year and how much you've paid for the engagement, create a bar chart with the following settings:
- Time Range - Select This year
- Metric - Specify the following:
- CTR
- CPC
- Segment - Select Month
Monthly cost per campaign
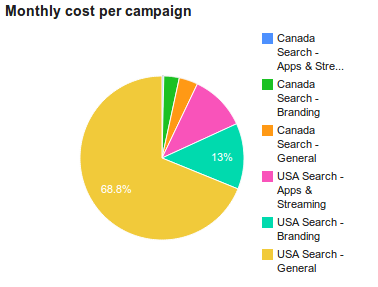
To compare the monthly cost per campaign, create a pie chart with the following settings:
- Time Range - Select Last month
- Metric - Specify Cost
- Segment - Specify Campaign. Then click +Add campaign and add each campaign.